The Pennsylvania Public Utilities Commission (PUC) released its Market Potential Study in late February 2020 and its Tentative Phase IV Implementation Order in March 2020, the latest step in the process of preparing for the expected fourth phase of the Act 129 electricity conservation program. PEA reviewed these reports to gain a better understanding of the findings and implications for Act 129 Phase IV in Philadelphia. The reports provide an analysis of the entire state broken down by Electric Distribution Companies (EDCs). PEA truncated findings to focus on PECO, which serves Philadelphia as an electric-only utility, as well as providing electric and gas services in Delaware, Chester, Montgomery, and Bucks Counties.
What is Act 129?
PA Governor Rendell signed Act 129 into law in 2008 and in doing so put into place a requirement that EDCs actively invest in ways to reduce energy consumption and demand. Act 129 states that “The total cost of any plan required under this section shall not exceed 2% of the electric distribution company’s revenue as of December 31, 2006,” which sets PECO’s budget at $85,477,166 per year. In practice Act 129 may only apply to:
- electrical energy efficiency,
- combined heat and power (CHP) generation, and
- opportunities associated with fuel-switching away from electric resistance space and water heating to fossil fuel space- and water-heating measures.
Act 129 does not require utilities to reduce direct natural gas or other fuel use.
Act 129 is carried out in 5-year program phases and the current phase, Phase III, runs through May 31, 2021. The next phase, Phase IV will operate from June 1, 2021 through May 31, 2026.
Why are we talking about Phase IV now?
The fact is that Phase IV planning started shortly after Phase III was underway. We are now getting to the part of the process where stakeholders will begin to have some say on what the EDCs Phase IV energy efficiency and conservation (EEC) programs will look like. Act 129 was written in a way to encourage continual review of the potential to hit goals in a cost-effective way and those goals have evolved through the phases.
This continual review also gives the PUC a chance to account for changes in technology and the economics of EEC measures. Those changes have been internalized through updates to the program’s Technical Resource Manual and the Technical Resource Cost Test, which were finalized in the summer and winter of 2019, respectively.
In February, 2020, the PUC released the Statewide Evaluator’s Energy Efficiency and Peak Demand Reduction Market Potential Study Report, which we discuss in more depth below. Then in March, 2020, the PUC released its Tentative Phase IV Implementation Order, which takes the findings from the Market Potential Study and proposes a game plan for Phase IV, giving guidance to the EDCs on their individual program designs and opening up the process for public input.
“With this Tentative Implementation Order, the Commission begins the process of evaluating the costs and benefits of the EEC Program and proposing the establishment of additional incremental reductions in electric consumption and peak demand.”
What does all this mean for Act 129 Phase IV?
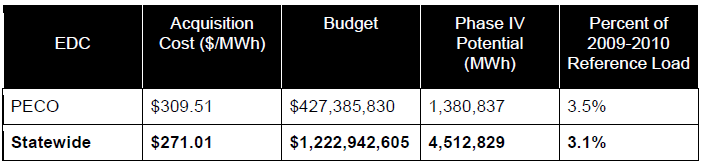
Much of the analysis performed in the Market Potential Study boils down to identifying an acquisition cost, which Table 1 indicates is 14% higher for the PECO territory than the state average. Given that the budget for each Phase of Act 129 is capped as noted above, the modeled acquisition cost yields the Phase IV program potential savings. Any stakeholders seeking to advocate for higher savings target would need to question this overall acquisition cost or the budget caps required in Act 129.
Table 1: Proposed Consumption Reduction Targets
The PUC also made some specific program recommendations for the EDCs:
- Design at least one comprehensive program – including a holistic mix of measures – for the commercial and residential sectors.
- Each EDC will be required to obtain a minimum of 5.8% of the total consumption reduction target from the low-income (< 150% FPL) sector.
- “The Commission invites stakeholders to propose a different approach that would harmonize the management and spending of Act 129 low-income funds with Low Income Usage Reduction Program funds that is also overseen by the Commission.”
- The PUC did not propose a carve-out for the government, non-profit, and institution (GNI) sector, because the Market Potential Study and historic performance indicated that GNI would make up a sizeable portion of savings without the need for a target.
- The PUC is allowing carryover of any savings in excess of Phase III targets into Phase IV.
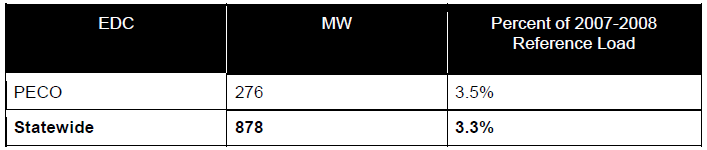
- The PUC also proposed peak demand reduction targets, which are shown in Table 3.
Table 2: Proposed Phase IV Low-Income Savings Targets

Table 3: Proposed Phase IV Peak Demand Reduction Targets
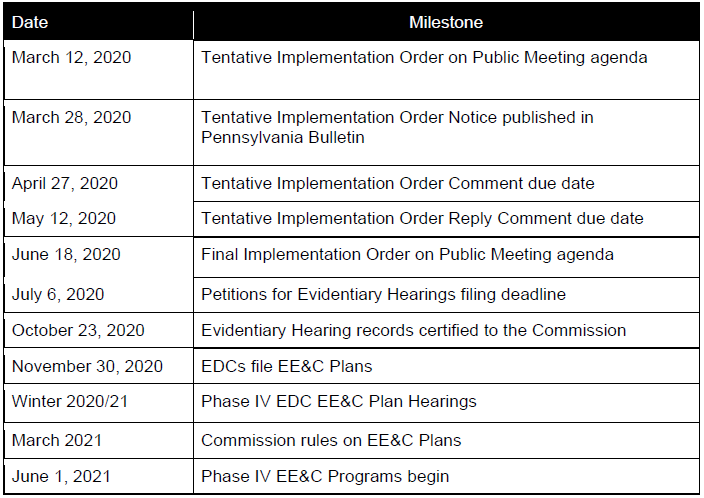
Timeline for Act 129 Finalization
The PUC provided a timeline for next steps in the table below. The public should note that there are opportunities to give feedback to the Tentative Implementation Order. There will also be opportunities to weigh in on the EDC filed plans in fall and winter 2020.
Deeper Dive into the Market Potential Study
As noted, the Market Potential Study (MPS) is the basis that the PUC uses to decide if a Phase IV of Act 129 is cost-effective, as well as to help design the performance targets for the phase.
Model considerations:
- The team modeled a low-income spending carve-out consistent with historical EDC levels in the low-income sector: approximately 13 percent of EE budgets.
- The modeling did not include “fuel switching opportunities that replace electric heating with fossil fuels.”
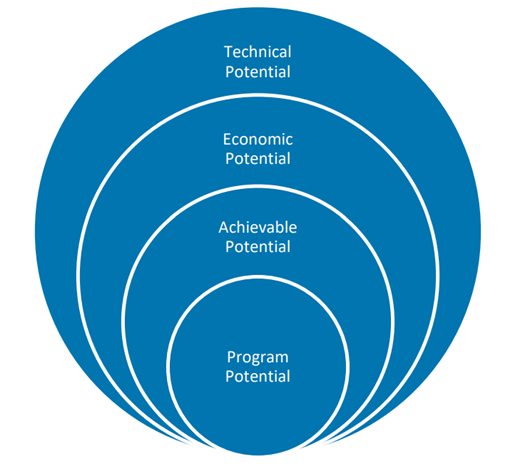
- The model began with a full Technical Potential and then narrowed down to the Program Potential. Economic Potential does not include any non-measure program costs, which are first considered in the Achievable Potential scenario. Finally, the Program Potential is budget constrained so it eliminates measures that are potentially cost-effective in lieu of available funding. Getting to the Program Potential also meant adjusting for market barriers to adoption which is reflected in the acquisition cost, modeling program ramp-up curves and accounting for budget constraints, and including a low-income carve-out.
Figure 1: The four standard efficiency potential scenarios
- Though the report’s model results for the Program Potential scenario get pretty granular, they are only truly representative for the low-income carve-outs, since other sectors are going to be influenced by policy and planning decisions at the EDCs.
What the model shows for the residential sector is much greater savings coming from the single family sector than multi-family. We also note that low-income single and multi-family account for a smaller portion of savings. This model works on the assumption that the low-income carveout remains the same as Phase III or 13% of total program cost, but market barriers account for the reduced savings in those low-income sectors. The report suggests that low-income residential has an acquisition cost (for MWh savings) of 2.5x that of non-low-income residential. A major takeaway from this analysis is the shift from lighting to other building systems to drive energy savings, and especially the highest savings category of whole-building savings.
Table 5: Program Potential sector spending, savings, and acquisition costs, 2021-2025 (Table 11 in source)
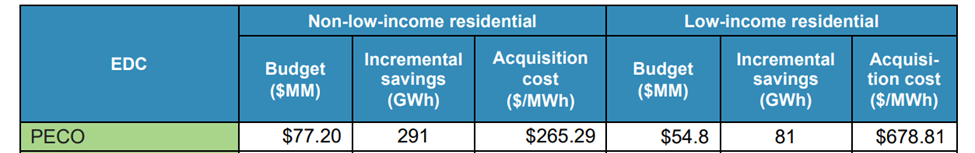

Table 6: Program Potential Residential incremental annual GWh savings by sector (Table 14 in source)
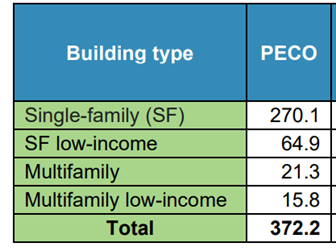
Table 7: Program Potential Residential incremental annual GWh savings by measure (Table 15 in source)
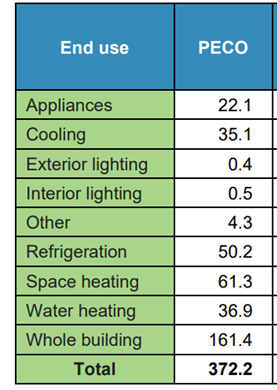
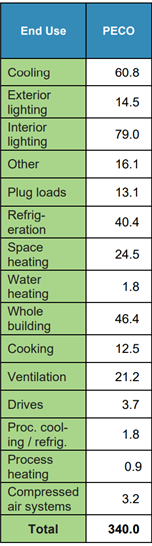
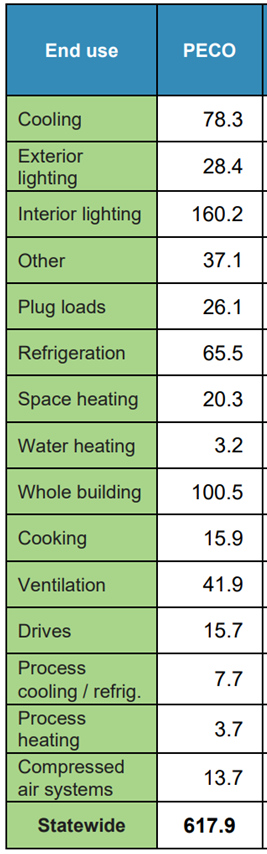
The C&I sector is divided into small (0-100kW peak demand) and large (>100kW peak demand). Notably, the small C&I sector demonstrates a higher benefit-cost ratio and lower acquisition cost than large C&I, though the large C&I sector has a higher net benefit. Both scales of C&I still show high savings potential in lighting measures, but there is also a high savings potential in cooling, refrigeration, ventilation, and whole-building improvements.
Table 8: Program Potential small C&I costs, benefits, and TRC benefit-cost ratios (Table 18 in source)
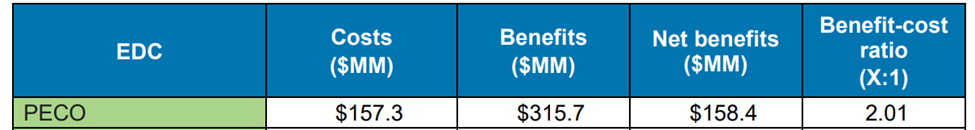
Table 9: Program Potential large C&I costs, benefits, and TRC benefit-cost ratios (Table 22 in source)

Table 10: Program Potential small and large C&I incremental annual GWh savings by sector (Tables 19 and 23 in source)
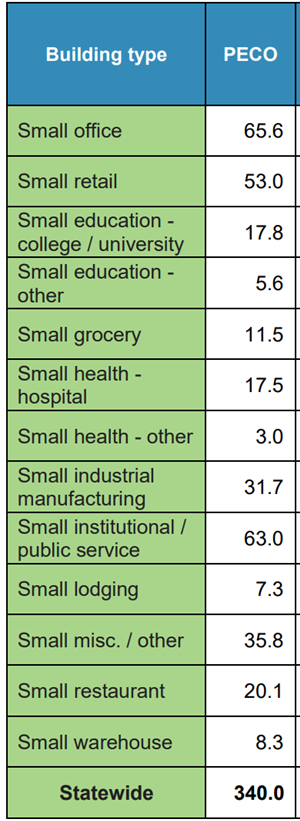
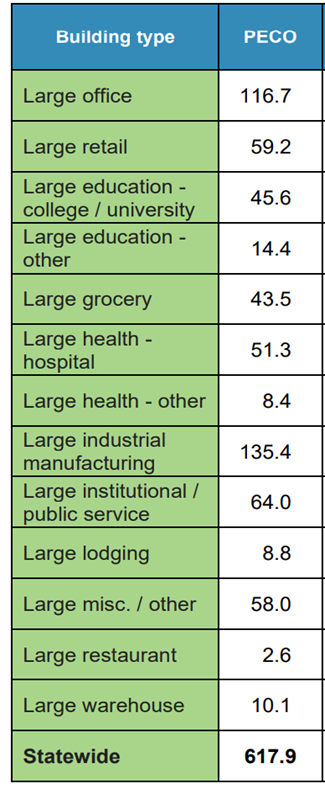
Table 11: Program Potential small and large C&I incremental annual GWh savings by measure (Tables 20 and 24 in source)